September 2023. When I finished the last part “too many too much” half a year ago, I was really convinced this “story” had reached its end. But when I started looking for sponsors several people started asking me: What’s next? Very slowly I changed my mind and asked myself, so what should be next? The energy transition everybody is talking about? The climate change nobody is talking about? So welcome back dear reader, I hope you will find this new part just as interesting as the other ones. Again, there is a strong connection with near future population growth.
Try to answer the next question.
What is always available; it is unimaginable you can’t have it; and you cannot live without it? Please bear in mind this question is posed by someone who lives in The Netherlands in North West Europe. I asked several friends the same question. One said “food”. Some said “the internet” and others showed me their I Phone.
20 Years ago I took a hike. A 10 day walk into the northwestern part of Scotland. Starting in Fort William and ending in Dundonnell. There is only one shop which you reach on day 6. You carry a backpack containing over 20 kilos of clothes, tent, sleeping mat and bag, cooking gear and food. Leave your I Phone at home, no signal. The only thing you can’t take with you is the answer to the question. You have to search and find it while you are walking in “the middle of nowhere”. There you will find the answer. You cannot survive without drinking water.
 Humanity’s global freshwater demand/use versus planetary freshwater resource. Main subject in this research and the first chapter. The major sources of information used are published scientific researches. One: The Emerging Global Water Crisis: Managing Scarcity and Conflict Between Water Users, Jury, Vaux, 2007. Two: The Observed State of the Water Cycle in the Early Twenty First Century, NASA, Rodell et all, 2015. Three: United Nations Educational Scientific and Cultural Organization World Water Development Report 2018, Unesco, 2018. Four: The 2007 Report on Climate Change, Intergovernmental Panel on Climate Change, 2007. Five: Water Use and Stress, Ritchie, Roser, 2015. I also “browsed” and visited numerous websites, any text or data I copied is “quoted” and accordingly mentioned as source.
Freshwater resource.
Earth’s atmosphere and oceans were formed 2 billion years ago according to, the most agreed upon, scientific theory and estimations. Having an atmosphere is a major change for a planet. Earth’s atmosphere makes us, as far as we know today, unique in the universe. Because our atmosphere has two special qualities: it allows radiation (sunlight) to pass through but it blocks gases (water vapor). The logical consequence of having an atmosphere is that the global quantity of water has been the same for 2 billion years. During this period there have been only differences in the “form” of water; as water exists as a liquid (salt, fresh), as a gas (water vapor), as a solid (ice, snow, hail and sleet). The global water volume will always be the same, therefore you can say it has a limit.
Freshwater resource.
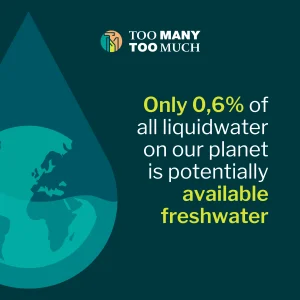 Of all the liquid water on the planet 97,4% is salt water in oceans and seas. The remaining 2,6% is freshwater suitable for human demand/use. The majority of this percentage is unavailable. It is frozen as polar ice and glaciers. This polar ice contains about 2% of the global freshwater supply. “Humans and all other terrestrial life must subsist on the remaining 0,6%” (The Emerging Global Water Crisis, Jury, Vaux, 2007)
Freshwater demand/use.
Global freshwater quantity is measured as volume flow rate. Local freshwater quantity is calculated in cubic meter/second, global freshwater quantity in cubic kilometer/year. One cubic meter contains a 1000 liters. One cubic kilometer contains 1000 x 1000 x 1000 cubic meters. One cubic kilometer freshwater equals to a 1000 billion liters.
Freshwater resource.
“The potentially available global freshwater resources are divided into groundwater and surface water”(The Emerging Water Crisis, Jury, Vaux, 2007). Freshwater resource for human demand/use is for the bigger part “stored” under the surface as groundwater. Global groundwater resource will be researched in the next chapter. The groundwater “issue” certainly needs this because it has a different “set” of specifics, dynamics, challenges and perspectives. In April 2023 the World Water Development Report 2022 was published in print. It has Groundwater as title. I ordered it at my local bookstore and waiting for it to arrive. I imagine it is the most elaborate and “up to date” groundwater research currently available. Land surface water on the planet is located in different resources; the biggest percentage in lakes; the rest in swamps, wetlands, rivers and reservoirs. “Planetary supplies of freshwater are relatively well characterized. There are no large groundwater deposits in relative accessible locations. Any new resources discovered will be very expensive to develop” (The Emerging Water Crisis, Jury, Vaux, 2007). As I mentioned before: the total volume of global water (liquid, solid, gas) has been, and will be always the same and therefore has a limit. You could say the same for the global volume rate of freshwater potentially available from today’s accessible resources: that also has a limit.
Freshwater resource.
Peculiar in the quoted researches: mountain snow water and melt water from continental glaciers are not mentioned at all. Mountain snow and glacier melt water are a freshwater resource for millions of people in warm and dry seasons, but only temporary available and unevenly distributed.
Freshwater demand/use.
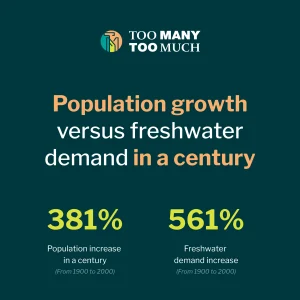
“The global freshwater withdrawal for human demand/use for the year 1900 is estimated at 671 cubic kilometers, for 1950 the estimation is at 1.230 cubic kilometers. The start of the second millennium (2000) has an estimated freshwater withdrawal of 3.790 cubic kilometers” (World in Data Website, Water Use and Stress, global freshwater withdrawals for agriculture, industry, and domestic use, Ritchie, Roser, 2015). To be clear: The sources I quote describe freshwater withdrawal as: freshwater withdrawn + freshwater consumed. As opposed to other current researches, in my opinion complicating the issue. Concluding this section is easy: global annual freshwater withdrawal for human demand/use increased 561% in a century. In the same time period the world population number grew from an estimated 1,6 billion to 6,1 billion; an increase of 381%.
Freshwater resource.
Continental glaciers and mountain snow cover have strong similarities. To exist they both need a temperature below Zero Degrees Celsius. In colder seasons snow falls forming mountain snow cover and snow is also the principal “building block” of a glacier. In colder seasons glaciers grow through the accumulation and transformation of snow cover, into ice. Above Zero Celsius mountain snow melts (only a very small part doesn’t) and a glacier shrinks. To create a freshwater source for warm and dry seasons, especially in regions where other sources are temporary unavailable or very scarce. A resource for large ecosystems and millions of people.
Freshwater demand/use.
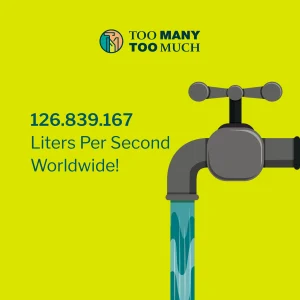
“Global annual freshwater withdrawal for human demand/use has been increasing by 1% every year since the 1980s” (World in Data Website). The main driver for this increase is global population growth. The estimated volume rate of global annual freshwater withdrawal reached, for the first time in 2007, the new record number of 4.000 cubic kilometers. If this volume rate is considered as an exact number, not an estimate, the daily global freshwater withdrawal for human demand/use in 2007 would have been 10.958.904.109.589 liters. That is almost 11 Trillion (United Kingdom Trillion, that is 11 followed by 12 zeros) liters. Humanity’s global freshwater withdrawal in one day. I checked the calculation numerous times and I am still struggling to “wrap my head around” this number.
Freshwater resource.
 For snow to fall and a glacier to grow you will need a temperature below Zero Degrees Celsius. “Global day and night-time temperature has risen about the same rate” (Report on Climate Change, Intergovernmental Panel on Climate Change, 2007). The number of days, and more important, nights below Zero Celsius is decreasing. “Decline in mountain snow pack and mountain snow depth are measured in Western North America and the Swiss Alps. This also results in the decline of mountain snow water”( Report on Climate Change 2007). “In the United States of America, mountain snow water supplies up to 75% reservoir freshwater in western states. In Switzerland mountain snow water boosts water levels in rivers and lakes and replenishes drinking and agricultural water supplies” (Valuing Water Initiative Website). The global rise in temperature increases the melting and shrinking of continental glaciers in warmer seasons. But that is the minor problem. The major problem lies in the decreasing growth of glaciers in colder seasons. Glaciers shrink more than they grow in their annual cycle. In some regions, or at lower altitudes, glaciers are disappearing because they only shrink and stopped growing at all.
Freshwater demand/use.
I decided to use the 2007 estimate of global freshwater withdrawal as a “current” estimate. Estimating the current annual global freshwater withdrawal at 4000 cubic kilometers is “a tricky one”. I can’t find an estimation for 2023. I have seen estimates vary from “3.800 cubic kilometers in 2017” (World Water Development Report 2023, Unesco, 2023). To “3895 cubic kilometers in 2020” (World Bank Open Data Website). To “4600 cubic kilometer in 2018” (Reassessing the projections of the World Water Development Report, Boretta, Rosa, 2019). “The uncertainties in making estimates are too great to support a quantitative analysis. The authors argue that the lack of comprehensive monitoring means that conclusions are not based on solid empirical evidence”(The Emerging Water Crisis, Jury, Vaux, 2007). In the current science “language” commonly phrased as “estimates having a high level of uncertainty”. Maybe the safest way is to say: the current annual global human freshwater withdrawal is “at least” 4.000 cubic kilometers.
Freshwater resource.
 When I ask: Do you think current global freshwater demand/resource are a cause for concern? You will answer: Why, it’s raining!!! In theory there is absolutely no problem concerning freshwater. Because it rains. It rains an awful lot. There is a tremendous volume rate of freshwater falling from the sky. If this was resulting in an even distribution on the planet, in location as well in time period; if it rains a bit everywhere every day: no problem at all. But you know, as well as I know: in the real world it doesn’t work like this. I would like to add a personal touch: if this “everywhere everyday scenario” would exist we would be living on a pretty boring planet. Lacking the very different ecosystems of today, lacking the diversity that makes life so interesting.
Freshwater demand/use.
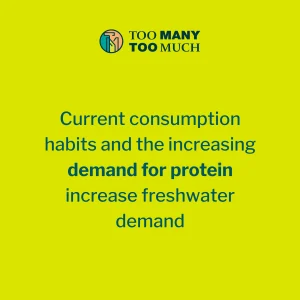
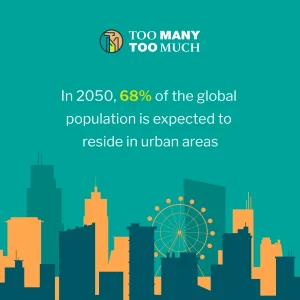
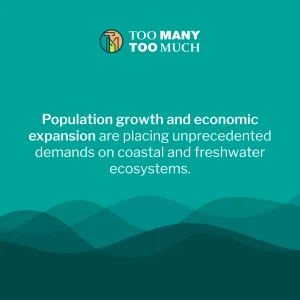
 There is a similarity between this new part 4 and part 2 called people want protein. Do you remember this: ”The richer a country is, the more meat an average person tends to eat” (Meat and Dairy production, Ritchie, Rosado, Roser, 2009). Freshwater demand/use “works” on the same principle: the richer a country is the more water an average person tends to use. Or formulated like this: “The inter-linkage in between population and economic growth and water demand” (NPJ Clean Water Website, Reassessing the projections of the World Water Development Report 2018). A few pages back there was a discrepancy. Global freshwater withdrawal from 1900 to 2000 increased 564%. Global population growth in the same time period was “only” 381%. The difference can be explained by looking at a century of increasing industrialization, urbanization and drastic changes in consuming patterns. The world in 1900 looked very different from today, to describe all the changes I chose just one aspect. “Urban living is a very recent development. In 1900 84% of the global population lived in rural areas. Of 1.6 billion people 256 million lived in urban settings” (World in Data Website, Urbanization, Ritchie, Roser, 2018). “Comparing rural life to urban life: the significant increase in domestic water demand is attributed to the increase in water supply services to urban settlements” ( World Water Development Report 2018). People in cities use more water because more water services are available. In 2023 a number of 4560 million people live in cities, towns, and villages. This is 57% of the global population, and this percentage is estimated to increase to 68% in 2050. In my opinion the discrepancy between 561% and 381% is solved, by looking at a century of increasing socio–economic development.
Freshwater resource.
Liquid water on the surface of our planet evaporates into the atmosphere as water vapor. Water vapor condensates into liquid and falls back to the surface as precipitation. A small part as snow: “About 5% of the total precipitation falls as snow”( Levizzani et all, 2011). The water cycle in its basic principle. “Shiklomanov, Gleick, 1993 estimates that each year about 502.800 cubic kilometers water evaporates over the oceans and seas” (United Nations Environment Program Website). And you must have heard the phrase: what goes up must come down. “Approximately 505.000 cubic kilometers of water falls down as precipitation each year, 398.000 over oceans and 107.000 over land” (Wikipedia Website, Precipitation).
Freshwater resource.
A NASA (National Aeronautics and Space Administration) research published July 2015 in the Journal of Climate estimates: “Each year heat from the sun evaporates 449.500 cubic kilometers water from the world’s oceans. On land 70.600 cubic kilometers of water evaporates from soil and plants” (The Observed State of the Water Cycle, NASA, Rodell et all, 2015). Totaling “what must come down” a precipitation volume rate of 502.100 cubic Kilometers. That is over a 120 fold of annual global human demand/use, estimated at “at least” 4000 cubic kilometers. “The NASA research made use of 25 satellites, on a 10 year survey (2000 – 2010) of our planet’s water cycle. The resulting data/estimates are based on satellite measurement first and data integrating models second” (NASA, Global Climate Change Website). I have decided to “quote” this research because it is extensive (10 years) and recently published (2015). “The study also calculated that 403.000 cubic kilometers precipitation fall (straight back in) over the ocean each year and 116.500 fall over land surface”( The Observed State of the Water Cycle, NASA, Rodell et all, 2015). To finish this section: this 116.500 cubic kilometers of freshwater is the staggering volume rate that falls over our heads every year. Like I said: it rains an awful lot.
Freshwater demand/use.
Human needs for freshwater take precedence over other demands. This is a hazardous behavior because a human is not the only living creature on this planet. Humans cannot survive without Earth’s terrestrial ecosystems, ecosystems cannot survive without freshwater. “Postal et all, estimates that about 18% of all available freshwater in 1990 was used directly by humans, and an additional 34% is required to maintain adequate ecological health” (The Emerging Water Crisis, Jung, Vaux, 2007).
Freshwater resource.
Where and when annual global land surface rain falls is unevenly distributed over the planet. There are regions with an annual moderate and sufficient volume of rain, enough for ecosystems and human freshwater demand/use. There are very large areas with shortage and even extreme droughts. And regions with excessive amounts of rain and severe floodings. The period in time in which rain falls, or not falls, is determined by the annual cycle of seasons. A well-known example is the Monsoon in India, Sri Lanka, Bangladesh and Myanmar. The summer season, from April to September, brings a humid climate with loads and loads of rain. The winter season, October to April, brings a warm and dry climate with barely a shower of rain.
Freshwater resource.
“The water cycle is often taught as a circular cycle of evaporation, condensation and precipitation. Although this can be a useful model, the reality is much more complicated” (National Oceanic and Atmospheric Administration, NOAA Website). It may sound strange to you but where rain touches the land surface of our planet there are a lot of “options”. “The water cycle has many processes. Infiltration: liquid water flows into the ground. Percolation: liquid water flows through the ground. Runoff: liquid water flows across land. Evaporation: liquid water evaporates from land. Transpiration: the water movement through a plant.” (NOAA Website). Land surface rain is a huge potentially available freshwater resource. What I am trying to “find out” is: how much of this staggering resource “goes through” all this processes of the water cycle? And what is the volume rate available for human demand/use after that? To finally establish if there is cause for concern regarding current global freshwater demand/resource. Or not, because it rains!!!
Freshwater resource.
“Of the annual global land surface precipitation 60% evaporates into the atmosphere”(The Observed State of the Water Cycle, NASA, Rodell et all, 2015). It took me 3 weeks to find that “evaporates” is not the appropriate term to account for this 60%, a volume rate of 70.600 cubic kilometers. “Evapotranspiration is the sum of all processes by which water moves from the land surface to the atmosphere via evaporation and transpiration” (United States Governmental Science Website). 70.600 Cubic kilometers evaporates and transpires into the atmosphere. This includes 3 processes. Infiltration: liquid water flows into the ground. Transpiration: the water movement through a plant. Plants “take up” infiltrated water, use 0,5%-3% for growth, the remaining 97-99,5% leaves the plant (transpires) as water vapor. Plants, crops, bushes/shrubs and trees, they all transpire. Anything with roots on one end and leaves, stems, flowers, seeds, fruit or needles at the other. It is transpiration through which terrestrial ecosystems grow and prosper, through which agriculture provides us with food. The annual global evapotranspiration volume rate is for the biggest part a transpiration volume rate. The smaller part is process number 3. Evaporation: liquid water evaporates from surface water and land. Land surface evaporation is mainly evaporating soil moisture.
Freshwater resource.
“Of the annual global land surface precipitation 39% runs through streams and rivers into oceans and seas” (The Observed State of the Water Cycle, NASA, Rodell et all, 2015). The proper name for this 39%, a volume rate of 45.900 cubic kilometers is runoff. “Runoff: liquid water flows across land” (NOAA Website).
Freshwater resource.
Have you, dear reader, noticed what is happening here? Just a few pages ago I started with 502.100 cubic kilometers of freshwater falling from the sky every year, a 120 fold volume rate of freshwater demanded/used by humans every year. On the next page reduced to an estimate of 116.500 cubic kilometers, “the part that falls over our heads”. A 29 fold of annual human demand/use. And just now reduced to runoff, 45.900 cubic kilometers of potentially available freshwater. From a potentially available resource a 120 fold; to a resource roughly an 11 fold of annual global human demand/use.
Freshwater demand/use.
When you “google” global freshwater withdrawal 2050 you will not find an “exact” estimate for that year. You will find only “random” ones. Unesco (United Nations Educational Scientific and Cultural Organization) “estimates a growth of annual global freshwater withdrawal by 10–12% every 10 years, reaching approximately 5.240 cubic kilometers in 2025”. Another one: “a global freshwater withdrawal in 2050 between 5.500 and 6.000 cubic kilometers” (World Water Development Report 2018, Unesco, 2018). The Report also states: “these estimations of future population and water demand are the best we have, though it is realized such forecasts are difficult”.
Freshwater demand/use.
Human freshwater withdrawal from river runoff, a potentially available freshwater resource of 45.900 cubic kilometers, is “differential”. It varies strongly from extreme overuse (overdraft) in high density populated urban and industrialized areas, to a low withdrawal in sparsely populated rural areas. To illustrate this I have two examples for you. “The Amazon River is the world’s largest, widest and deepest river. It’s runoff discharge exceeds the combined discharge of the world’s nine next longest rivers”(Wikipedia Website, Amazon River). It has an estimated annual runoff volume rate of 6.932 cubic kilometers. The Amazon River Basin covers a surface of 7 million square kilometers, I have seen population estimates between 30 to 47 million people. It doesn’t matter which is correct. The logical conclusion is: the huge amount of freshwater transported by the Amazon River is barely touched by human hands on its journey to the Atlantic Ocean. The Colorado River is the only and vital freshwater resource for 40 million people. The Colorado River is an example of a “developed” river, it has 15 dams in its main stream, one of them being the Hoover Dam for hydropower. “An extensive system of dams, reservoirs and aqueducts divert almost its entire flow for agricultural irrigation and urban water supply”(Wikipedia Website). In the year 2000 it stopped raining for two decades in the southwestern United States, but freshwater withdrawal kept going in “the business as usual” scenario. “Colorado River Basin is drying up due to a combination of overuse of water resources and a historic drought”(Washington Post Website). Intensive water withdrawal, first for irrigation and second for urban (Los Angeles, Las Vegas, Phoenix) water supply has dried up the lower 160 kilometer of the Colorado River. Freshwater runoff has rarely reached the Golf of California since the 1960s.
Freshwater resource.
“Percolation: liquid water flows through the ground” (NOAA Website). This does not mean it is lost as potentially available freshwater resource. Not at all. Percolation is the annual global groundwater replenishment, commonly known as groundwater recharge. Liquid water that flows through the ground replenishes our “other” freshwater resource: groundwater. As mentioned before: groundwater is the next chapter of this research. Percolation is the part of the “rain budget” that is not directly available as surface water resource. The quoted NASA research estimates that less than 2% of the annual rain budget flows through the ground into groundwater storage.
Freshwater demand/use.
The other research I frequently quoted takes a slightly different approach on estimating near future annual global freshwater withdrawal. It estimates future global freshwater withdrawal in the “Business as Usual Assumption; assuming global population will grow and make no changes in consuming patterns” (The Emerging Water Crisis, Jung, Vaux, 2007). This research estimates “an additional 4.600 cubic kilometers will have to be found by 2025 to supplement global supplies (of freshwater resources) at the 1995 level”. The research also states: if the additional 1.2 billion population increase between 2025 and 2050 proves correct, another increase of 3.090 cubic kilometers is necessary by 2050”. To eventually drawing the same conclusion as I did: ”this leads to the staggering conclusion that nearly 7.700 cubic kilometers would have to be found by 2050 to supplement global supplies (of freshwater resources) at the 1995 level” (The Emerging Water Crisis, Jung, Vaux, 2007).
Freshwater demand/use.
The NPJ Clean Water Website describes the United Nations estimate of global 2050 freshwater withdrawal at 5.500 – 6.000 cubic kilometers as: “not to be very accurate and likely optimistic” (Reassessing the projections of the World Water Development Report 2018, Boretta, Rosa, 2019). Which is peculiar, because in the World Water Development Report 2018 a sequence of quite different estimations are mentioned. “Non -agricultural freshwater demand will increase substantially in the near future, driven by global population increase and social-economic development”. This is reflected in the “very bold” estimates in following components of economic growth. “Global manufacturing water demand is estimated to increase 400% from 2010 to 2050; global energy water demand is estimated to increase 85% from 2010 to 2035; industrial water demand increase in Africa estimated at 800%, Asia at 300% from 2010 to 2050; domestic water demand is estimated to increase 300% in Asia and Africa, 200% in South America” (NPJ Clean Water Website, Reassessing the projections of the World Water Development Report, Borretti, Rosa, 2019). Finally, although the increase in non-agricultural water demand exceeds the increase in agricultural water demand; global freshwater withdrawal for agriculture will remain the largest.
Freshwater demand/use.
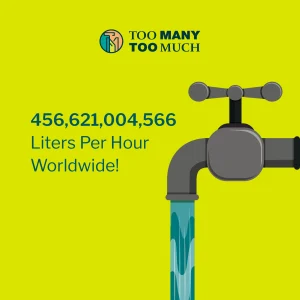
I presented the “at least” estimate of current annual global human freshwater withdrawal a while ago. I imagined it to be a real number instead of an estimate and calculated an “at least real number” for the current daily global human freshwater withdrawal. If you experienced this as intimidating, controversial, or confrontational I apologize for that. I just used the calculator on my I Phone, that’s all. I would like to do it again now. It’s easy, 4.000 cubic kilometers of freshwater is 4.000 trillion liters. As this research is an attempt to communicate in “United Kingdom English”, this means you have to add 12 zero’s. If you have this number in your calculator, divide by 365 and divide by 24. Now you have found the “real number” for the current global freshwater withdrawal demanded/used by the human race every hour. Fourhundredfiftysixbillion – sixhundredtwentyone million – fourthousand – fivehundredsixtysix liters. In one hour we use 456.621.004.566 liters of freshwater, at least.
Freshwater resource.
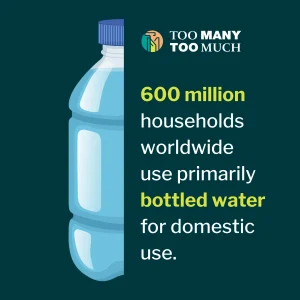
I am aware of the fact that millions of people have to walk for miles every day to obtain their daily supply of freshwater. On our planet we have huge areas where water is very scarce or even unavailable. The number of “water stressed” and/or “water scarce” countries varies from 9 to 25 to 40; depending on what classification is used. The number of global households primarily using bottled water is estimated at 600 million. Due to the expected population growth in Asia, Africa and South America this number will increase substantial. For all people on the planet, experiencing shortage of water, the local freshwater resources are a cause for concern, or even alarm.
Freshwater resource.
Very wet, the opposite of very dry, is also reality for millions of people. In the Mediterranean region is a relatively new phenomenon: the Medicane. The Mediterranean Hurricane. In the 2022-2023 Medicane Season the medicane Latifa lasted 7 days, bringing hurricane 160 miles/hour winds, loads and loads of torrential rains and severe floodings. Medicane Daniel hit Libya with torrential rains causing two dams near the city of Derba to collapse. The resulting flood flushed one third of the city into the Mediterranean Sea, drowning an estimated 4000 to 5000 people. Totally, Medicane Season 2022-2023 brought 16 storms. For all people on the planet, experiencing an excessive volume of water, the local freshwater resources are a cause for concern, or even alarm.
Freshwater resource.
When I looked for the first time at the annual global awful lot of rain I expected there would be a substantial part “redundant” and available for human purposes. I Could not be more wrong. After months of researching the “ins and outs” of the annual global water cycle I finally realized: there isn’t a substantial redundant freshwater resource, free to use by the human race. Every component of the water cycle has its own purpose, its “part to play”. The annual global water cycle provides freshwater for all global freshwater demand. For all life and all species on the terrestrial land surface. Humankind is just one of these many, many species.

Freshwater resource.
The global number of lakes is open for debate. “The research used an automated algorithm called GWEM (GeoCoverTM Water Bodies Extraction Method), the research found 117 million lakes larger than 0,0002 square kilometers” (Geography Realm Website). “We map 3,4 million lakes on a global scale” (Mapping lake dynamics, Xuehi Pi et all, 2022). “Our research estimates a number of 307 million lakes as scientists analyzed data from fine-resolution geographical information systems” (Current Results Website). Like I said: open for debate. Mental.
Freshwater resource.
How to determine the global amount of lakes by using our common sense, very unscientific I’m afraid. The first step: define a lake. A lake is not a puddle, pool or pond. The second step: AFK. A term from the online game world which means going to your front door to collect your ordered pizza, to the refrigerator for your energy drink, or toilet. Away from keyword. Dear researchers on this planet: step away from your keyboard. Put on your hiking shoes like I did. Stop modeling and start monitoring. In short: define a lake, go out and start counting. It is mentioned before: “The authors argue that the lack of comprehensive monitoring means that conclusions are not based on solid empirical evidence” (The Emerging Water Crisis, Jury, Vaux, 2007).
Freshwater demand/use.
I am sorry it took so long. For me it lasted 4 months of daily research, writing, more research and rewriting. But I thought it necessary to “tick all the boxes”. And that is “a tricky one”, quite a challenge as I was encountering numerous researches, researches having numerous calculations and estimations. To finally reach a conclusion and find the proper “key word” also took me a few weeks. That key word is proportional. Looking at the annual global water cycle, its components are “in proportion”. The global water cycle enables all life and many, many species to “thrive and prosper”. Proportional withdrawal equals proportional resource. Global human freshwater withdrawal is a cause for concern. Because human freshwater withdrawal is “out of proportion”. Disproportional. We are just one of many, many species. Of all species on our planet we are number one in freshwater withdrawal. Our current freshwater withdrawal is 456.621.004.566 liters in one hour, “at least”. By demanding/using a disproportional part of global/local freshwater resources we unbalance the water cycle. By demanding/using a disproportional part of global/local freshwater resources we deprive other life on this planet from their proportional resources. Current human behavior is a cause for concern, our freshwater withdrawal unbalances the availability of freshwater resources for other life on Earth.
Freshwater demand/use.
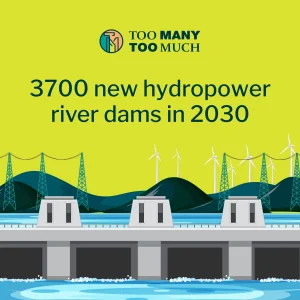
The effects of a disproportional surface freshwater withdrawal, in a worst case scenario, are visible in south east Asia, the Mekong River. The Mekong “starts” in the Himalaya, continental glacier melt water its original source. Mekong River is 4350 kilometer long, enters and leaves 6 countries and “ends” in the South Chinese Sea. “The Mekong River is also called the Battery of South-East Asia. The Mekong has the fastest growing hydropower construction of any large river basin worldwide” (Wikipedia, Mekong Website). The Mekong River has more than 160 hydropower dams operating through the Basin, including 13 XL dams on the main stream. Some 34 hydropower projects are under construction since March 2023 (It is estimated that by 2030 at least 3700 new XL hydropower river dams, above 150 meters high, will be added to the current global number).
 The general principle of a river dam is: to collect/store water. To create a reservoir for irrigation purposes, urban water supply, flood control, hydroelectricity. The difference of purpose doesn’t change the general principle: collect/store water. And that is exactly the problem. By collecting/storing water a disproportional volume of freshwater is withdrawn from the river, water that is supposed to flow, to run off into the sea or ocean. This general principle is depriving all that grows and lives at the ”lower side” of the river dam of its proportional freshwater resources.
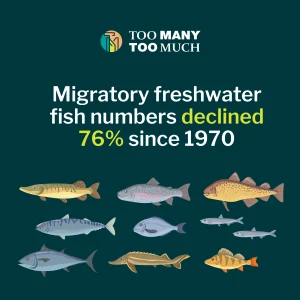
The Upper Mekong Basin is changed from a thundering and tumbling river to a “mega staircase” of eleven reservoirs created by a sequence of eleven hydroelectric dams. Local fishermen describe the river as a serial of ponds connected by canals. “All life and ecosystems in the Mekong Basin are based on the annual wet season / dry season flow cycle of the Monsoon. Ecosystems have developed in step with this ancient rhythm”(As hydropower dams quell the Mekong’s life force, what are the cost, Carolyn Cowan, March 2023, Mongabay Website). Hydropower dam operators do not want “high’s and low’s”, for optimal hydropower generation they prefer a steady constant flow. Operators restrict water in wet seasons, filling their reservoirs; and release water in dry seasons. Restricting water flowing in wet season results in no more flooding of the “food plains”, no deposit of sediment to fertilize ecosystems and crop fields. By releasing water in the dry season farmers are unable to work on their fields or herding their life stock. Exactly the opposite to the natural annual flow cycle. Farmers say: “I do not understand what the river wants”. Due to the lack of sediment deposit ecosystems collapse and riverbanks are eroding. “According to Gary Lee, Southeast Asia program director of International Rivers: large scale dams are disrupting the flow of water and sediments and damaging key aquatic ecosystems and resources” (Mongabay Website). The major aquatic ecosystem is migration of fish. Fish migrate. They what? “More than 1000 types of freshwater fish migrate seasonally up and down the river to reproduce. The Mekong yields one-fifth of the world’s total freshwater catch every year” (Mongabay Website). To reproduce fish return to their “birth water”. A very carefully chosen very specific stretch of the river. Usually “way up” Mekong River and its tributaries, looking for pristine water quality and no predator around. I imagine you see the problem. In research called: severed migration routes. In reality the majority of birth waters is no longer accessible. The Mekong River Commission research in 2002 states: “Water management projects such as hydroelectric dams could impact those migrations and negatively affect the livelihoods of a large number of people” (Fish migrations of the Lower Mekong Basin: implications for development , planning and environmental management, MRC, October 2002). A large number of people is an understatement. “It is estimated that 40 million rural people in the Lower Mekong Basin are engaged in the wild capture fishery. Dam projects on the Mekong River will reduce aquatic life by 40% in 2020, and an estimated 80% of fish will be depleted in 2040”( Wikipedia, Mekong Website).
Freshwater demand/use.
In the 1970s the Mekong Delta was meant to be “Vietnam’s Rice Bowl” The Vietnamese government started a program to become the world’s largest exporter of rice. The current reality in the Delta is quite different from the 1970s. The Mekong Delta is where all previously mentioned effects of Mekong’s disproportional withdrawal of surface freshwater resources “add up”. Sediment deposit is not only the perfect fertilizer, it also creates and “builds up” land in the Delta. If there is no sediment deposit in a coastal area, the sea or ocean will eventually “claim it back”. In the Mekong Delta available groundwater resources are being used excessively for agricultural purposes; also the Delta is being used for “sand mining”, sand is a resource for building houses and infrastructure for an increasing population number. Sediment deposit could have been a compensating factor, but there isn’t any. The combination of groundwater overdraft, sand mining and lacking sediment deposit causes the bottom of the Delta to, very slowly, sink. “The Mekong Delta inexorable sinks” (Mongabay Website). Adding up this effect with the other previously mentioned brings us to the ultimate effect. In the Mekong Delta not only freshwater is flowing out, seawater is flowing in. “Record low water level of the waterways and rivers are causing salt water intrusion that is reaching far inland, up to 90 kilometers from the estuaries, wiping out crops and contaminating water supplies” (Asia Times Website). Local groundwater resources are being replenished by the incoming South Chinese Sea, rendering them unavailable for human demand/use. Local economy switched from growing rice to growing prawns and seaweed. The Rice Bowl is broken. “Agricultural researchers warn that the entire Mekong Delta, home to more than 20 million people, could be mostly under water within a generation” (Asia Times Website).
Freshwater demand/use.
 To find an example for disproportional groundwater withdrawal was easy. Jakarta sinks. The capital city of Indonesia sinks into the Jakarta Bay. The “quotes” in this section are from the National Geographic Website: “Jakarta is sinking, can the government save it”, Renaldi, 2022. That Jakarta sinks is, for a part, to blame on my ancestors. “When the Dutch (from the Netherlands) colonized Indonesia in 1619 they began transforming the city to make it resemble a typical Dutch town” Jakarta sits in a delta with 13 rivers flooding in the annual monsoon cycle. The Dutch don’t like floodings. So the Dutch dug canals for flow regulation and lesser flooding. We, the Dutch, are very good at that. What we didn’t know is our behavior created a problem. “The alluvial soil of the delta compacts over time, causing the land to subside (sink) unless it is continually replenished with new sediment”. Lesser and shorter floodings create a lack of necessary sediment deposit. Since the 1990s the number and volume of floodings is changing. Major floods have happened every few years due to global climate change. But this change does not solve the lack of sediment deposit. Because 1990s Jakarta is not like 17th century Jakarta. Jakarta is turned into a megacity. Massive urbanization has exacerbated the situation. Widespread replacement of floodplains, forests and other vegetation has reduced how much water and sediment can be absorbed. Because vegetation is replaced by concrete and pavements. Resulting in massive runoff and even flash floodings. Sediment deposit is not possible on concrete and pavements. And still it is safe to say the lack of sediment deposit is a minor problem. “Jakarta has an estimated population number of 11,4 million” (Macrotrend Website). The major problem is that Jakarta’s millions of people live “on top” of their freshwater resources. Surface water in the city is unavailable for consumption. “More than 90% of municipal wastewater is discharged untreated into waterways” (Circleofblue.org Website). Jakarta’s rivers are the city’s toilet, flushing raw sewage into Jakarta Bay. Jakarta is indeed “sitting on” its only available freshwater resource: groundwater.
Freshwater demand/use.
“Jakarta’s piped water system serves fewer than 1 million households”. Looking at the current fertility rate of Indonesia brings us to “around” 4,5 million people having access to governmental issued freshwater. The majority of the city’s population, “around” 7 million people have no running water from a communal tap. 7 Million people rely primarily on pumping groundwater. “Such pumping is not illegal, but only allowed subject to taxation. The provincial government is unable to monitor and tax the untold number of unregulated deep wells scattered across the city”. To understand what that means I have another quote: “In May, the Jakarta city authority inspected 80 buildings in Central Jakarta’s Jalan Tharmin, a road lined with skyscrapers, shopping malls and hotels. It found that 56 buildings had their own groundwater pump and 33 were extracting water illegally”. (Jakarta, the fastest sinking city in the world, Mei, Hildegard, 2018, BBC News Website). One road in a megacity, 70% is pumping groundwater, of which 40% is illegal. The government estimated groundwater withdrawal in 2018 at 8 billion liters. In my humble opinion a pretty wild guess, due to the former statement: “the provincial government is unable to monitor and tax the untold number of unregulated deep wells”. And the city is still growing. “Independent researchers in 2011 estimated Jakarta had already used an alarming 64% of its groundwater reserves” (National Geographic Website). Which brings us to the major problem, subsidence. “Subsidence, sinking of the ground because of underground material movement” (NOAA Website). Groundwater resources are a part of the structural integrity of the bottom under our feet. By withdrawing approximately two-thirds (64%) of groundwater resources Jakarta is sinking. “Jakarta is now sinking at a truly alarming rate that is variable across the city”. Estimations for the south are at 1 to 3 centimeters, for the north at 15 to 30 centimeters. Every year. “About 40% of the city is below sea level”(Jakarta, the fastest sinking city in the world, BBC News Website). Real estate is still in the business as usual modus. “None of this has deterred property developers. More and more luxury apartments dot the north Jakarta skyline, regardless of the risks. The head of the advisory council for Indonesia’s Association of Housing Development, Eddy Ganefo, says he has urged the government to halt further development here. But, he says, as long as we can sell apartments, development will continue” (BBC news Website). Mental.
The first part of the National Geographic article: “Jakarta sinks” is now answered. What about the second part: “can the government save it”. The governmental response to Jakarta’s current “issues” is reflected in two major action plans. The first action plan has 2 different phases. The first phase started in 2014: the construction of the Coastal Wall. To protect vulnerable communities along the north coast facing a grim reality: subsidence, sea level rise and storm surges. The coastal wall will be 28 miles long, 8 miles are already built. Critics think “the coastal wall is at best a temporary solution”. It will sink at the same rate as northern Jakarta does. The second phase has a lot more grandeur: The Giant Sea Wall. A wall offshore in Jakarta Bay, including a 20 mile long artificial island shaped in the form of Garuda, the national “giant bird” symbol. To be developed resembling the Palm Islands of Dubai with its state of the art skyscrapers. The cost of the Giant Sea Wall have been estimated at 20 to 58 billion American Dollars; it is still in the design and planning stage, funding for construction is unknown, the government hasn’t announced a start date. Critics say: “the Great Sea Wall would obstruct the flow of 13 rivers, turning Jakarta Bay into a giant pool of sewage”. The basic flaw in both phases of the project is its failure to address the disproportional withdrawal of groundwater resources, the major cause of Jakarta’s land subsidence. The city won’t stop sinking. The second major plan has an entirely different approach. Nunsantara, the new Jakarta. In April 2019 the government announced to build a new capital on the island Borneo, 1300 kilometers from the current capital. Construction of Nunsantara started in July 2022 and should be completed in 2045. In February 2024 the new capital city’s infrastructure is 14% completed. “Construction worker (some 7000) dormitories, basic roads and a helipad are already being used. Construction of the presidential palace should be completed by summer 2024. The new capital is expected to be inaugurated on August 17 2024” (Euronews.green Website, Indonesia unveils construction site of new capital city, Hannah Brown, 2023).
Freshwater resource versus freshwater demand/use.
 This last section is not for the people who walk miles every day to obtain their daily supply of freshwater. They know. Not for people who have only bottled water available for primary use. They know. Not for people on a hike in northwest Scotland. They know. On our planet 2.7 billion people are living in areas where freshwater is scarce or unavailable for one month in a year. They know. This last section is for the majority of the world population, for those who forgot. They live, work and have children in areas where freshwater is an available resource. They assume freshwater resources are a commodity. Or a service. Or a product, with unrestricted access if you can afford it. To fill up the inflatable large swimming pool for the kids on a hot summer day. They forgot what our freshwater resources are. Freshwater resources are a basic necessity. And currently available freshwater resources have a limit.
“Making the invisible visible” is actually the title of the World Water Development Report 2022, from now on referred to as WWDR 2022. Published by the United Nations Educational, Scientific and Cultural Organization, also known as Unesco. I “chewed myself through” all 225 pages. Warning: do not try this at home, the printed version is quite expensive and will eventually end in the bin. If you think this WWDR 2022 is an excellent reading experience you will be very disappointed. It is a summary of current global research in groundwater. “Translated” into an extensive Report, as groundwater has its own “set” of specifics, dynamics, challenges and perspectives. Unfortunately the WWDR 2022 has all “the typical jargon and style” of a scientific research.
The number of actual researches the WWDR 2022 mentions as source/reference is 705. That is why I wanted to read it, for the first time someone made an effort to collect/summarize current global groundwater research. Exactly that effort makes this Unesco World Water Development Report 2022 unique and very special.
A proper resumé of this extensive WWDR 2022 in “a few pages” is impossible. If I would use more than this few pages you will eventually stop reading, because it will be utterly boring. So, it took me a considerable amount of time to find the solution to this problem. Although I am researching global freshwater for 8 months now, the WWDR 2022 contains a series of pretty stunning research results. To summarize the WWDR 2022 I am going to give you a small collection of the, in my opinion, most extraordinary ones. I divided them in the different aspects global groundwater has, each aspect containing a series of remarkable “quotes” from the WWDR 2022. I realize this collection is based on my personal choices and, from a scientific perspective, even can be characterized as “random”.
Global groundwater research.
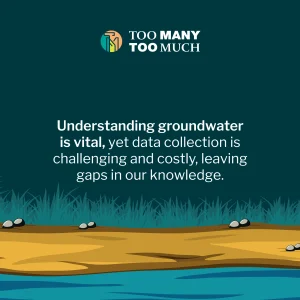
(1)The lack of groundwater data and groundwater monitoring initiatives emphasizes that groundwater monitoring is a neglected area of research today. (2)Germonov (1974) estimated a global volume of liquid freshwater at 10,6 million cubic kilometers. More recent estimates include those of Kotwicky (2009) estimating a global freshwater volume at 11,1 million cubic kilometers, and by Ferguson et al (2021) estimating the freshwater groundwater component only at 15,9 million cubic kilometers. All estimates are partly based on rather arbitrary assumptions, therefore it is not possible to decide which estimate is the most realistic one. (3)The numerical information in groundwater research is based on countless uncoordinated observations on variables that are difficult to assess; documentation on the processing is usually lacking. Therefore, this information is unavoidably subject to significant uncertainty, even to the extent that different versions of the same variable are circulating.
Global groundwater resource.
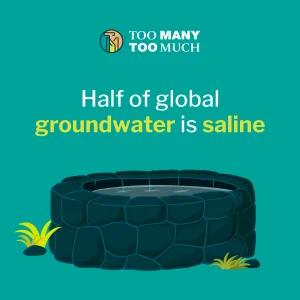
(1)Although most groundwater within a few hundred meters below the surface is fresh, more than half of all global groundwater under the land surface is saline and therefore unsuitable for most types of water use. (2)High groundwater salinity prevails in the deeper domain basins, but in many zones scattered over the world it is also observed at shallower depths. For instance in coastal areas and in zones with very shallow resources in arid climates. Furthermore, near ocean-shore groundwater withdrawal may trigger seawater intrusion, which will put an end to local withdrawal of fresh groundwater.(3)The largest groundwater storage systems in the world, located in deep sedimentary basins, are up to few millions square kilometers in lateral extent (wide) and thousands of meters deep. The deeper parts of such systems are filled with saline water.
Global groundwater withdrawal.
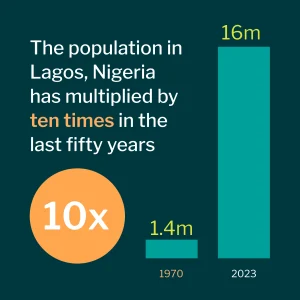
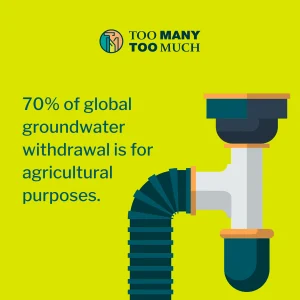
(1)Groundwater is a critical resource for irrigated agriculture, livestock farming and other agricultural activities, including food processing. Regions heavily reliant on groundwater for irrigation are North America and South Asia. As population and income growth drives demand for more intensive and higher-value food production, global groundwater withdrawals for agricultural purposes are increasing. (2)Primary energy and power production are the biggest single users of industrial water. High-energy processes need large quantities of cooling water. For example: steel and metal smelters use 30 cubic meters of water per ton of steel, while refineries use 1,5 cubic meter of water to process 1 cubic meter of crude oil. (3)Approximately 70% of global groundwater withdrawals, and even more in arid and semi-arid regions (Margat and van der Gun, 2013), are used in the agricultural production of food, fibers, livestock and industrial crops. (4)The groundwater dependance of innumerable cities appears to intensifying, nearly 50% of global urban population is estimated to be supplied from groundwater sources. (5)It is estimated that the globally aggregated groundwater withdrawal in 1950 was only 158 cubic kilometers. The total global groundwater withdrawal during 2017 is estimated at 959 cubic kilometers. (6)The Asia-Pacific region is the largest groundwater abstractor in the world. Bangladesh, China, India, Indonesia, Iran, Pakistan and Turkey (in alphabetical order) together account for roughly 60% of the world’s groundwater withdrawal. India accounts for nearly 26% of global abstracted groundwater (Margat and van der Gun, 2013). (7)In developing economies the use of private water wells for urban self-supply increased in recent years. Originally a coping strategy because of the lack of piped water, currently to avoid paying higher water tariffs. In the city of Lagos (Nigeria) about 20% of the 18-20 million population are served by utility supply. About 50% owns a private water well, and another 30% obtains water from these private sources. (8)Industries with a high groundwater dependency include the food and beverage sector, as well as in the textile/clothing industry where many production processes need large amounts of water for washing and cleaning their products at the end of production, in order to separate residues of processing chemicals.
Global groundwater pollution.
(1)Groundwater pollution is a virtually irreversible process, once polluted, groundwater storage zones tend to remain polluted. (2)Coal contains many toxic chemicals, including arsenic, radium and other carcinogens. Coal burning to produce electricity concentrates these toxic chemicals in the waste coals ashes. As a result of leaching through coal ash dumps (coal ash dams/waste ponds and unlined landfills), coal has significant impact on groundwater quality, as the effects may last for years. Given the large number of coal-fired plants worldwide, it might be fair to conclude that the impacts to groundwater globally could be extensive. Moreover, the issue is compounded by the large amount of closed ash dumps still present. (3)It is estimated that agricultural pollution has overtaken contamination from settlements and industries. Agricultural pollution is widespread and often includes large quantities of nitrate, pesticides and other agrochemicals. Nitrate, from organic and chemical fertilizers is the most prevalent contaminant in groundwater globally. (4)Evidence suggests that laws and regulations to prevent or limit diffuse groundwater pollution from agriculture, and especially their enforcement, are generally weak. (5)Groundwater pollution reduces the suitability of abstracted groundwater for drinking purposes and also affects groundwater dependent ecosystems.
Global groundwater dependent ecosystems.
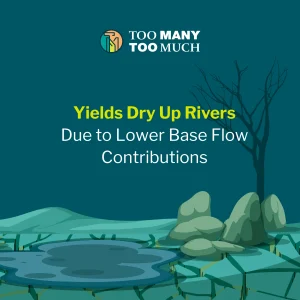
(1)Aquatic groundwater dependent ecosystems can be found across a variety of landscapes, ranging from high mountain valleys to the bottom of the ocean and even in deserts. Possibly the most obvious groundwater dependent ecosystems are springs: highly diverse, endemic and abundant ecosystems found in over 2,5 million locations, including caves, fountains, geysers and seepages (Cantonati et al, 2020). Though small, spring habitats are exceptionally biodiverse. (2)Groundwater discharge supports the baseflows of streams and rivers, a crucial water source for huge ecosystems. Baseflow can contribute nearly 100% of streamflow in some humid regions. In contrast baseflow can be an insignificant contributor to streamflow in many arid regions. Baseflows also determine the risk of a river falling dry during periods of drought.
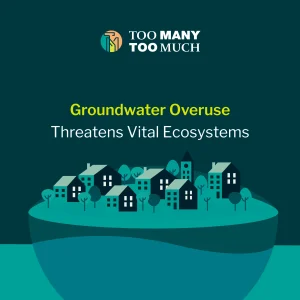 (3)In many areas, it can be observed that groundwater dependent ecosystems suffer and degenerate as a consequence of uncontrolled intensive groundwater abstraction by individuals or companies in pursuit of short-term economic profits. (4)Water holes in arid environments are often purely groundwater-fed, and thus groundwater is crucial to sustaining the complex food web of arid landscapes, such as savannahs. (5)Groundwater discharging to marine environments is a ubiquitous phenomenon along coastlines. It creates unique ecosystems where saltwater and freshwater mix (Lecher and Mackey, 2018) and can be a substantial nutrient source for coastal and estuarine waters. In high salinity water like the Dead Sea, groundwater inflow sustains local ecosystems that otherwise would not be able to tolerate the salinity (Ionescu et al, 2012). (6)Groundwater dependent ecosystems are very vulnerable to intensive groundwater withdrawal. Continuously expanding groundwater withdrawal across the globe causes global-scale decline of river baseflows , springs, wells and wetlands; leading to loss of biodiversity and encroaching desertification in the long run. (7)Groundwater dependent ecosystems can be impacted by known and emerging contaminants (pesticides, pharmaceuticals, recreational drugs and personal care products), and by nutrient pollution from domestic and urban wastewater.
Global groundwater depletion.
 (1)Groundwater storage depletion occurs when discharge exceeds recharge (to keep it simple: when more is going out than is getting in). Most cases of long-term groundwater depletion result from intensive abstraction. (2)Long-term groundwater depletion is observed in countless groundwater resources, predominantly located in semi-arid and arid regions. (3)The Arab region is one of the most water-scarce regions in the world, at least 11 of the 22 Arab States use groundwater as their primary water source. Over-extraction of groundwater in many parts of the region has led to groundwater storage declines, especially in highly populated and agricultural areas. Most groundwater resources are without recharge (nothing is getting in, there is only going out), in fact they are a finite resource. (4)Groundwater dependent ecosystems and the related ecosystem services are threatened by groundwater depletion, climate change and land use changes. Groundwater depletion, the persistent decline in water levels, impacts both aquatic and terrestrial ecosystems. Streamflow depletion, the lowering of streamflow due to groundwater pumping is a significant concern for aquatic ecosystems(Gleeson and Richter, 2017).
World Water Development Report 2022 conclusions.
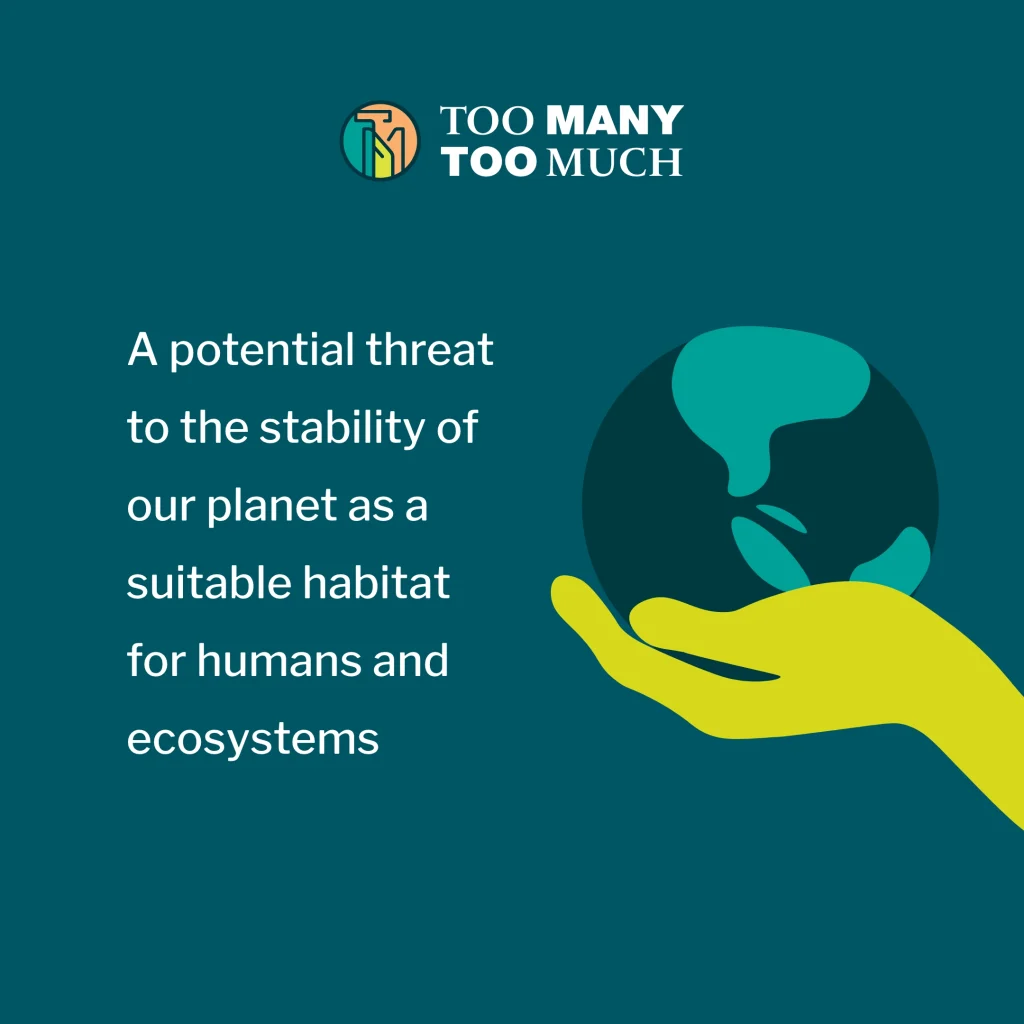
(1)The Earth’s total groundwater resources represent an enormous supply of freshwater. However, in spite of its overall abundance, groundwater remains vulnerable to overexploitation and pollution, both of which can have devastating effects on the resource and its availability. (2)An estimated 4 billion people live in areas that suffer from severe physical water scarcity for at least one month a year. Typical responses for these areas are: transfers from neighboring water-surplus areas if available; or depleting stored water volumes of lakes, reservoirs or groundwater resources. (3)Variations over time, such as seasonal variation, climate change and especially intensive groundwater exploitation have drastic impact on local and regional scale. Examples are: (a)shrinking lakes; (b)the disappearance of numerous springs around the world; (c)declining flows in rivers; (d)steadily falling groundwater levels. (4)Different processes within the global water cycle regulate climate and support ecosystems. Human activities, including groundwater withdrawal, currently are a major force disturbing these processes. Potentially causing planetary-regime shifts that threat the stability of our planet as a suitable habitat for humans and ecosystems.
 Chapter 1 mentioned how I, before this research started, assumed a lot about groundwater. Now I will quote myself for a change: “I assumed groundwater to be separated from surface water”. And another quote, even worse: “A giant freshwater resource explicitly or exclusively for human purposes”. Followed by some more really bad ones. I could not be more wrong. The WWDR 2022 uses this words: “Groundwater is intimately interconnected and interacting with many other components of the Earth’s physical environment. Atmospheric water and surface water percolates into the subsoil to become groundwater, which in turn sooner or later either discharges into surface water bodies or into the sea/ocean; or returns to the atmosphere through evaporation”(United Nations World Water Development Report 2022, Unesco, 2022). Stored groundwater will “sooner or later” return to our planet’s surface; feeding streams, rivers, wetlands, lakes, swamp lands, groundwater dependent ecosystems and “last but not least” humans. Sooner or later is the proper phrase for the time scale in which groundwater reappears on the surface. This time scale has no limit. Groundwater can reconnect with surface water within a few days, or after thousands and thousands of years. It is generally assumed global human groundwater withdrawal is not a problem because the global groundwater resources have an overwhelming volume rate. Wrong again. An unlimited local groundwater withdrawal can lead to severe consequences regarding local surface water resources. Because groundwater is in connection with surface water.
After looking at the global water cycle for weeks on a row, it was very clear to me water vapor is a key element. Through the cycle of evaporation and condensation water vapor is the major driver of global climate. Water vapor is also the major driver of our planet’s natural greenhouse effect.
The greenhouse effect is a natural process. “Without it the average temperature at Earth’s surface would be below the freezing point of water. Earth’s natural greenhouse effect makes life as we know it possible” (Report on Climate Change 2007,Intergovernmental Panel on Climate Change, 2007). Water vapor is the number one natural greenhouse gas, carbon dioxide being the second in line. Water vapor is the major driver of the natural greenhouse effect, but not a direct cause for global climate change. In the quoted Report on Climate Change 2007 the water vapor cycle is called “a positive feedback”. This positive feedback can be “translated” into: a matter of cause and effect.
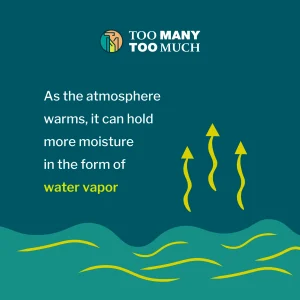 Due to global climate change global temperature is increasing. “As the atmosphere warms, it can hold more moisture in the form of water vapor”(World Economic Forum Website). Or currently phrased in scientific researches as: due to global warming atmospheric water vapor content, or water vapor capacity, is increasing. Due to global warming there is more water vapor in the atmosphere. An increased water vapor content; water vapor being a natural greenhouse gas; in turn, amplifies global warming. Resulting in an additional increase in global temperature. This additional increase in temperature, in turn, results in an additional increase in water vapor content. Which again; water vapor being a natural greenhouse gas; in turn, results in an amplification of global warming. Resulting in “the next” additional increase in global temperature. This “next” additional increase in temperature, in turn, results in “the next” additional increase in water vapor content. A positive feedback, a matter of cause and effect. This water vapor amplification of global warming is also referred to as “a positive feedback loop”. “Increased water vapor does not cause global warming. Instead, it is a consequence of global warming”(NASA Science.gov Website, how atmospheric water vapor content amplifies Earth’s greenhouse effect, NASA Science Editorial Team, 2022).
The Report on Climate Change 2007 phrases it like this: “As the atmosphere warms due to rising levels of greenhouse gases, its concentration of water vapor increases, further intensifying the greenhouse effect, in a self-reinforcing cycle”(IPPC, 2007). The rate of increase in water vapor content in 2007 was, on average, 4,9% per degree Celsius global temperature rise. “Over the ocean, the observed increase rate is 5,7% per degree Celsius; on land the rate of increase is slightly smaller at 4,3%”(Report on Climate Change 2007, IPPC, 2007). That 4,9% water vapor increase rate was observed in 2007. We are in 2024 today and global temperature has increased. That brings us to another aspect of global atmospheric water vapor content. “Any change in temperature alters the volume’s water capacity. The higher the temperature, the more vapor a volume of air is capable of holding. The maximum water vapor capacity increases at an increasing rate as temperature increases”(NOAA Global Monitoring Labority.gov Website, Water Vapor Investigation). In 2007 the increase rate in water vapor content was an average 4,9% per degree Celsius global temperature increase; in 2023 this rate was observed at 7%.
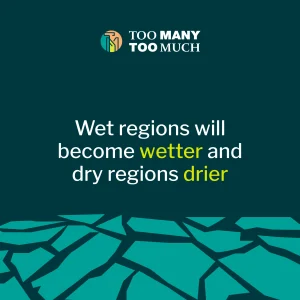 The quoted NASA Website mentions another aspect: “Increases in global atmospheric water vapor content make wet regions wetter and dry regions drier”(NASA Science.gov, NASA Science Editorial Team 2022). The first part of this statement “sounds” logical. The increased capacity/capability to hold more water in the atmosphere results in an increased evaporation from global surface water. Maybe the best word is “ability”. The ability to hold more atmospheric water vapor results in more evaporation, which results in more precipitation. Wet climate zones become wetter. “However, increased evaporation is expected to increase drying, particularly in already dry regions where surface moisture is already limited”(NASA Science.gov, NASA Science Editorial Team, 2022). In dry/arid climate zones more soil moisture is extracted from an already dry surface. Because the atmosphere has an increased ability to hold more water vapor. Dry climate zones become drier.
The Report on Climate Change 2007 researches several climate change positive feedbacks. The water vapor cycle feedback is a major one. It substantially amplifies/accelerates global warming. Water vapor is a key element in global climate and the global water cycle; a key element in the natural greenhouse effect and global warming. Although the water vapor cycle feedback loop is not a so called “direct driver” of global climate change.
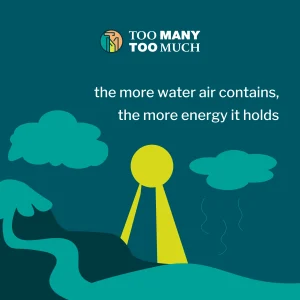 The Report on Climate Change 2007 concludes this subject like this: “This water vapor feedback may be strong enough to approximately double the increase in the greenhouse effect due to the increase in carbon dioxide alone”(IPCC, 2007). The quoted NASA research concludes in this manner: “Increases in water vapor content amplify the global water cycle. The more water that air contains, the more energy it holds. This energy fuels intense storms, particularly over land; resulting in more extreme weather events”(NASA Science Editorial Team, 2022).
This is the last time I will ever quote the Report on Climate Change 2007. In that year I was one of the few “non-scientific” people who made an effort to read it. The 2007 Report is actually the IPCC Fourth Assessment Report; the First was published in 1990, the Sixth in 2021. The 2007 Report on Climate Change was a milestone in global climate change scientific research. For the first time there was scientific consensus. Scientific agreement about: what causes global climate change. The so-called “direct driver” of global climate change is the human species. Of course this question, and this answer were already researched before 2007, the answer even assumed in certain scientific subdivisions, but never accepted worldwide. In the recent past of global climate change research the result was never conclusive, there were a lot of “ifs and buts”, reasons for doubt, for debate and even denial. Because of the lack in “the level of confidence” with which climate change research results were presented. If you look at the history of global climate change research and the question “are we the cause?” the First Assessment Report in 1990 answered: maybe. The Second Report in 1995 answered: probably. The Third in 2001 answered: likely. There never was scientific agreement, always reasons to ask the next question and the need to upgrade the research to the next level. Until 2007. For the first time: no more doubts. The research result was presented with a “very high confidence level”. Which represents a 90-100% confidence in the research itself and the research result. The Report on Climate Change 2007 announced: for the first time there is scientific consensus regarding the cause of global climate change; for the first time including the required confidence level to make this announcement valid. No more doubt, debate or denial: “The understanding of anthropogenic warming and cooling influences has improved since the Third Assessment Report, leading to a very high confidence that the global average net effect of human activities since 1750 has been one of warming”(The Report on Climate Change 2007, IPCC, 2007). My last quote. The so-called “direct driver” of global climate change is the human species. Because of our number and our behavior. Too many people using too much. Too many too much.